(This guide, and others, can also been found in the Opus FAQs at the Directory Opus Resource Centre forums.)
Programs like Explorer and Directory Opus are at the mercy of the third-party components they load. This includes things like shell extensions and video codecs which may be added by other programs you have installed.
When those third-party components go wrong they can cause crashes or memory leaks within the programs they are loaded into. This post discusses a way to track down components causing memory leaks.
What is a memory leak?
A memory leak is when a program allocates memory and then doesn't give it back when it is no longer needed. The leaked memory is wasted because the program itself is no longer using it but nothing else can use it either until the program exits.
High memory usage does not always mean there is a memory leak. If you are doing something that inherently needs a lot of memory, and that memory is given back when the operation completes, then that is not a memory leak.
Memory leaks are usually unbounded. If you keep doing something that triggers a leak then the memory usage usually keeps increasing. (If the memory usage only increases the first time you do something, and the increase isn't huge, then it's probably just a component allocating a cache which it will re-use to speed up future operations. Such caches are often returned after a few minutes of inactivity, although it depends on the component.)
Using VMMap to find memory leaks
If you look using Task Manager it might say explorer.exe or dopus.exe are using a lot of memory but it won't tell you where the blame lies. There could be a bug in the programs themselves but it's almost always a third-party component. Here's how to find out which one.
Download the free VMMap tool from Microsoft/SysInternals and extract its zip file somewhere. VMMap is a low-level debugging tool but don't worry, what we're going to do with it is quite simple.
- Double-click VMMap.exe and it should open a window with a list of running processes.
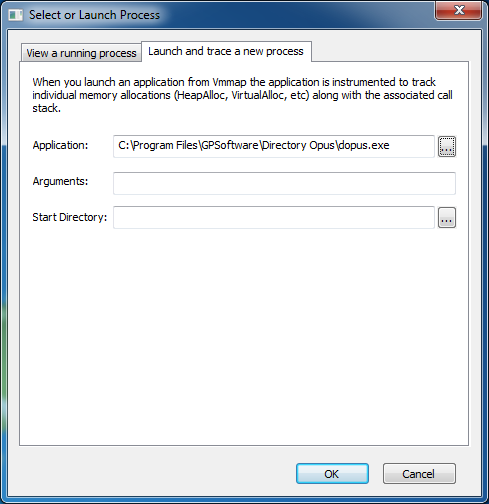
At the top of that window, click the Launch and trace a new process tab, then enter the path to dopus.exe, like below.
Do not click OK yet.

- Before you click OK you need to exit Directory Opus (dopus.exe) so that it can be re-started by VMMap. (This will allow VMMap to keep a record of the memory allocations made by the new dopus.exe.)
Simply closing all Opus windows will not exit it by default. Use the Exit option on Opus's tray-icon menu. (See also: How to Exit Directory Opus.)
- Now click OK in VMMap; it should re-start Opus.
VMMap will also display a colourful list of numbers but don't worry about understanding them. :)
Keep VMMap and Opus running; do not close either of them from now on.
- Use Directory Opus in a way which triggers your memory leak.
Ideally, trigger the leak several times so it is large and easy to find. (Make it leak at least 10MB, or more if you can, so it stands out from other memory allocations.)
Use the standard Task Manager to keep an eye on dopus.exe's memory usage so you can tell when you've triggered the leak.
- Return to VMMap and push F5 (or click View -> Refresh) to make it refresh.
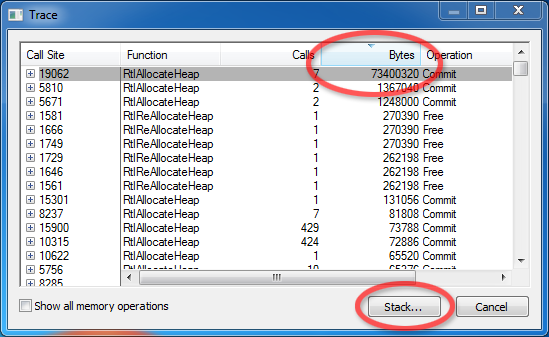
- Click Trace... at the bottom of the VMMap window:

- In the Trace window which appears, sort by the Bytes column and scroll to the top of the list.
It should look something like this where the first item has a much larger Bytes value than the others:

If the first item doesn't have a relatively large Bytes value then you may need to trigger the leak more times (keep VMMap running and remember to Refresh it each time you come back to it), or you may be incorrect about there being a leak at all. Otherwise, continue...
- Select the first item and then click Stack... at the bottom of the Trace window.
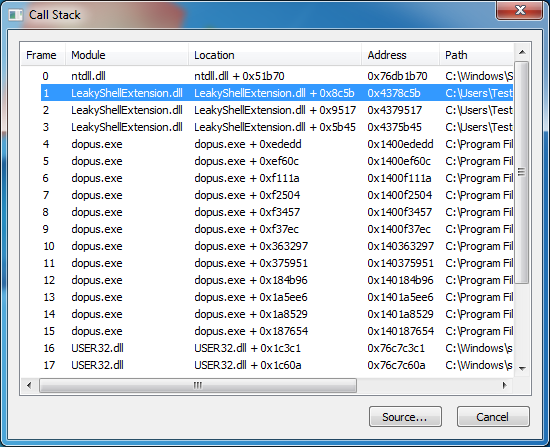
- You will now see a list of DLLs (and dopus.exe) involved when the memory was allocated, like this:

The component causing the memory leak is usually the first non-Windows DLL in the list. You can usually ignore the ones whose paths start with C:\Windows (e.g. ntdll.dll and user32.dll).
In the example above, the memory leak was caused by LeakyShellExtension.dll which, as you can guess, is a shell extension I wrote for this guide which intentionally leaks memory. I wrote it to leak about 10MB each time a file was right-clicked and then right-clicked files a few times to make it leak about 70MB in total.
- Once you have a suspicious DLL the name and path are often enough to identify what it belongs to. If not, find the DLL on disk, right-click it, select Properties and then go to the Details tab. That will usually contain information about who made it and what it's a part of.
Sometimes it's worth looking at some of the other DLLs in the list, too.
Once you know what the DLL belongs to you can try uninstalling (or updating) it to see if the leak goes away.
If the leak goes away then you know who to report the bug to.
If the leak remains, repeat the process and see which DLLs are indicated. If it's the same DLL again then you know that you didn't successfully uninstall it. If it's another DLL, maybe the first one was innocent and can be reinstalled.